The Wage Spiral Is Eating Your Business Alive. And Cutting Staff Is Making It Worse.
Executive Summary
Across UK hospitality, the instinctive response to wage pressure is to run leaner: cut a shift, reduce covers, ask the manager to pull a double. It feels prudent. It is almost always counterproductive. When a business operates with high fixed costs and a gross margin above 50%, the financial damage from slower service and lost covers consistently outweighs the labour saving. This article explains why the cutting reflex accelerates the spiral it is trying to stop, how to think about the real cost of an understaffed service, and what operators who are successfully protecting their margins are doing differently. The answer is not to ignore costs — it is to stop treating headcount as the primary lever and start treating staff productivity and revenue throughput as the variables that actually move the numbers.
The Spiral That Feels Like a Strategy
Every owner-led operator dealing with rising wage costs has tried the same set of responses. Cut a shift. Run Tuesday on two staff instead of three. Ask the manager to pull a double. Hire cheaper and train faster.
Six months later, they are sitting in exactly the same position. Except the reviews are worse. The team is exhausted. And the owner is back on the floor personally holding the operation together.

The National Living Wage has risen significantly over the past three years. In April 2023 it increased by 9.7% to £10.42 per hour. In April 2024 it rose a further 9.8% to £11.44. In April 2025 it increased again to £12.21 — a cumulative rise of over 22% in two years. For a hospitality business employing 15 people at or near the NLW, that represents tens of thousands of pounds in additional annual payroll with no corresponding increase in covers served or revenue generated.
The instinct to protect margin by cutting labour costs is not irrational. It is just that the mechanism has a flaw most operators do not see until they are already inside the spiral.
You cannot staff your way out of a staffing crisis by running with fewer staff. You end up with a slower business, lower average spend, more customer complaints, and a team that burns out and leaves — forcing you to hire and train all over again. The spiral does not stop. It accelerates.
The Maths That Changes How You Think About This
To understand why under-staffing is so financially damaging, you need to understand what your fixed costs are actually doing to your profit structure.
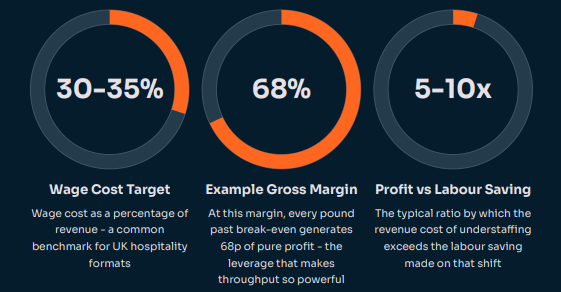
Consider a venue turning over £80,000 a month. Fixed costs — rent, rates, base wages, energy, insurance — sit at around £45,000 a month. Non-negotiable. They are there whether you are full on a Saturday or empty on a Tuesday. At a gross margin of 68%, the revenue needed to cover those fixed costs is £66,176 per month.
Here is the insight that changes everything. Once fixed costs are covered, every additional pound of revenue generates 68 pence of profit. Not contribution. Profit. The fixed cost machine is already running whether you use it or not.
So what does running a Friday lunch service on two staff instead of three actually cost?
If slower service means 30 fewer covers, at an average spend of £22 per head, that is £660 in lost revenue. At 68% gross margin, past break-even, that is £449 of pure profit handed back. Every single Friday. Over a year that is £23,300 gone - in exchange for saving perhaps £60 in labour cost on that shift.
A slow service at 7pm on a Wednesday is not neutral. It is losing money at full overhead cost with compressed revenue to offset it.
Why the Problem Is Productivity, Not Headcount
Most operators frame the wage spiral as a headcount problem. It is not. It is a productivity problem.
One person who can process an order in 45 seconds, knows the menu thoroughly, does not need to call a manager for every upsell decision, and can work across multiple service points simultaneously is worth three people fumbling through a slow system with outdated processes and no real-time visibility on what is selling.
The question to ask is not "how many staff do we need?" It is "how productive can each member of the team we have actually be?" Those are very different questions, and they lead to very different answers.

This distinction matters because the standard response to wage pressure - hiring fewer, cheaper people and running leaner - optimises for the wrong variable. It reduces input cost while simultaneously reducing output capability. In a high-fixed-cost business where revenue throughput is the primary profit driver, that trade-off is almost always negative.
When Cutting Is the Right Answer
It is worth being direct here: there are circumstances where cost reduction is the correct short-term response to wage pressure, and this article would be dishonest if it did not say so.
For a single-site operator who is genuinely operating below break-even, investing in new technology before the fundamental unit economics are sound would be premature. If the business is loss-making at current revenue levels, the priority is to understand why - whether that is pricing, volume, product mix, or location - before adding capital expenditure on systems.
Similarly, for operators at very low transaction volumes where the marginal cost of an additional system significantly exceeds the productivity gain it generates, the case for technology investment is weaker.
The argument in this article is not that cutting is always wrong. It is that cutting alone, as the primary and repeated response to wage pressure, is almost never sufficient - and in most established hospitality businesses operating above break-even, the revenue cost of understaffing is substantially higher than operators realise when they make the decision.
How Smart Operators Think About This Differently
The operators whose margins are growing while others are shrinking tend to share one mental model: they treat technology as a revenue lever rather than an overhead to be managed down.
The question they ask is not "can we afford to invest in better systems?" It is "what is it costing us every single month not to?"
That reframe matters because it puts the decision in the right financial context. An EPOS system that enables one member of staff to serve the equivalent of 1.3 members of staff at current productivity is not a cost. It is a return on investment with a calculable payback period. Faster throughput, fewer errors, better real-time stock visibility, and integrated payments that eliminate manual reconciliation are all measurable improvements with measurable revenue and margin implications.

The key metrics to monitor are: revenue per labour hour, average transaction time at the till, cover turn during peak service, and the gap between theoretical and actual stock levels. Operators who track these numbers have a clear view of where their productivity losses are occurring. Those who do not are managing by feel - and feeling their way through rising wage costs is an increasingly expensive approach.
What This Looks Like in Practice
A hospitality business that addresses wage pressure through productivity rather than headcount reduction typically works through the following progression.

The Standard Worth Holding
The operators who navigate wage pressure successfully are not necessarily the ones who invest the most or cut the most. They are the ones who understand their numbers clearly enough to make the right call in each situation.
Know your break-even. Know what each additional cover is worth at your margin past that threshold. Calculate what one more productive hour of service - one fewer queue, one faster table turn - is worth in real revenue. Most operators who run this calculation are genuinely surprised by how high the number is, and by how quickly the case for investing in better systems becomes obvious once the maths is laid out plainly.
At Truli, this is the conversation we start with every operator we work with. Not with a software demonstration - with a break-even calculation and a productivity audit, because without those numbers the rest of the conversation has no foundation. Our team includes people who have stood behind the same tills, managed the same rotas, and tried to grow businesses with systems that were not built for the way real hospitality actually works. That experience is why everything we do starts with your operation rather than our product.
If the wage spiral is a problem you are living right now, the most useful first step is not a sales conversation. It is getting honest about your real cost of an understaffed service shift - and whether the number you come up with changes how you are thinking about the decision in front of you.
Frequently Asked Questions
How do I calculate my break-even revenue?
Take your total fixed costs for a month - rent, rates, insurance, minimum staffing costs, energy, and any other costs that do not vary with trading volume. Divide that number by your gross margin percentage expressed as a decimal. So if your fixed costs are £45,000 per month and your gross margin is 68%, your break-even revenue is £45,000 divided by 0.68, which gives £66,176. Every pound you take above that number generates 68 pence of profit. If you do not know your gross margin with confidence, calculate it as: (total revenue minus cost of goods sold) divided by total revenue. This is the most important number in your business and worth spending time to get right.
What is the actual cost of under-staffing a service shift?
Calculate the number of covers or transactions you estimate you lost due to slower service or reduced capacity, multiply by your average spend per head, and then multiply that revenue figure by your gross margin percentage. If you are past break-even, that final number is pure profit foregone. Most operators find this calculation produces a much larger number than the labour saving they made on that shift - often by a factor of five to ten.
How does EPOS technology improve staff productivity without adding headcount?
Primarily by removing friction from the order and payment process. A well-configured EPOS system reduces the time per transaction, eliminates the need to call a manager for routine decisions, gives staff immediate access to menu and stock information, and handles payment reconciliation automatically. The cumulative effect across a full service is meaningful. A team processing orders 20% faster can handle proportionally more covers in the same time without any additional headcount - and at full gross margin past break-even, the revenue impact of that throughput increase compounds quickly.
When does investing in technology make more financial sense than hiring more staff?
When the annual cost of the technology is lower than the annual revenue value of the productivity improvement it generates, calculated at your gross margin. For most established hospitality businesses operating above break-even, this threshold is reached relatively quickly because of the leverage effect of high fixed costs. The calculation is less clear for very small or very low-volume operators, or for businesses that are not yet consistently past break-even, where the priority should be on the fundamental economics before adding capital expenditure.

What metrics should I track to know if my wage costs are sustainable?
The most useful are: revenue per labour hour (total revenue divided by total hours worked in the period), wage cost as a percentage of revenue (target varies by format but 30 to 35% is a common benchmark for UK hospitality), gross profit per cover or transaction, and cover turn during peak service periods. Tracking these consistently over time gives you an early signal when the relationship between staffing cost and revenue output is moving in the wrong direction - well before it shows up as a problem in your monthly P&L.